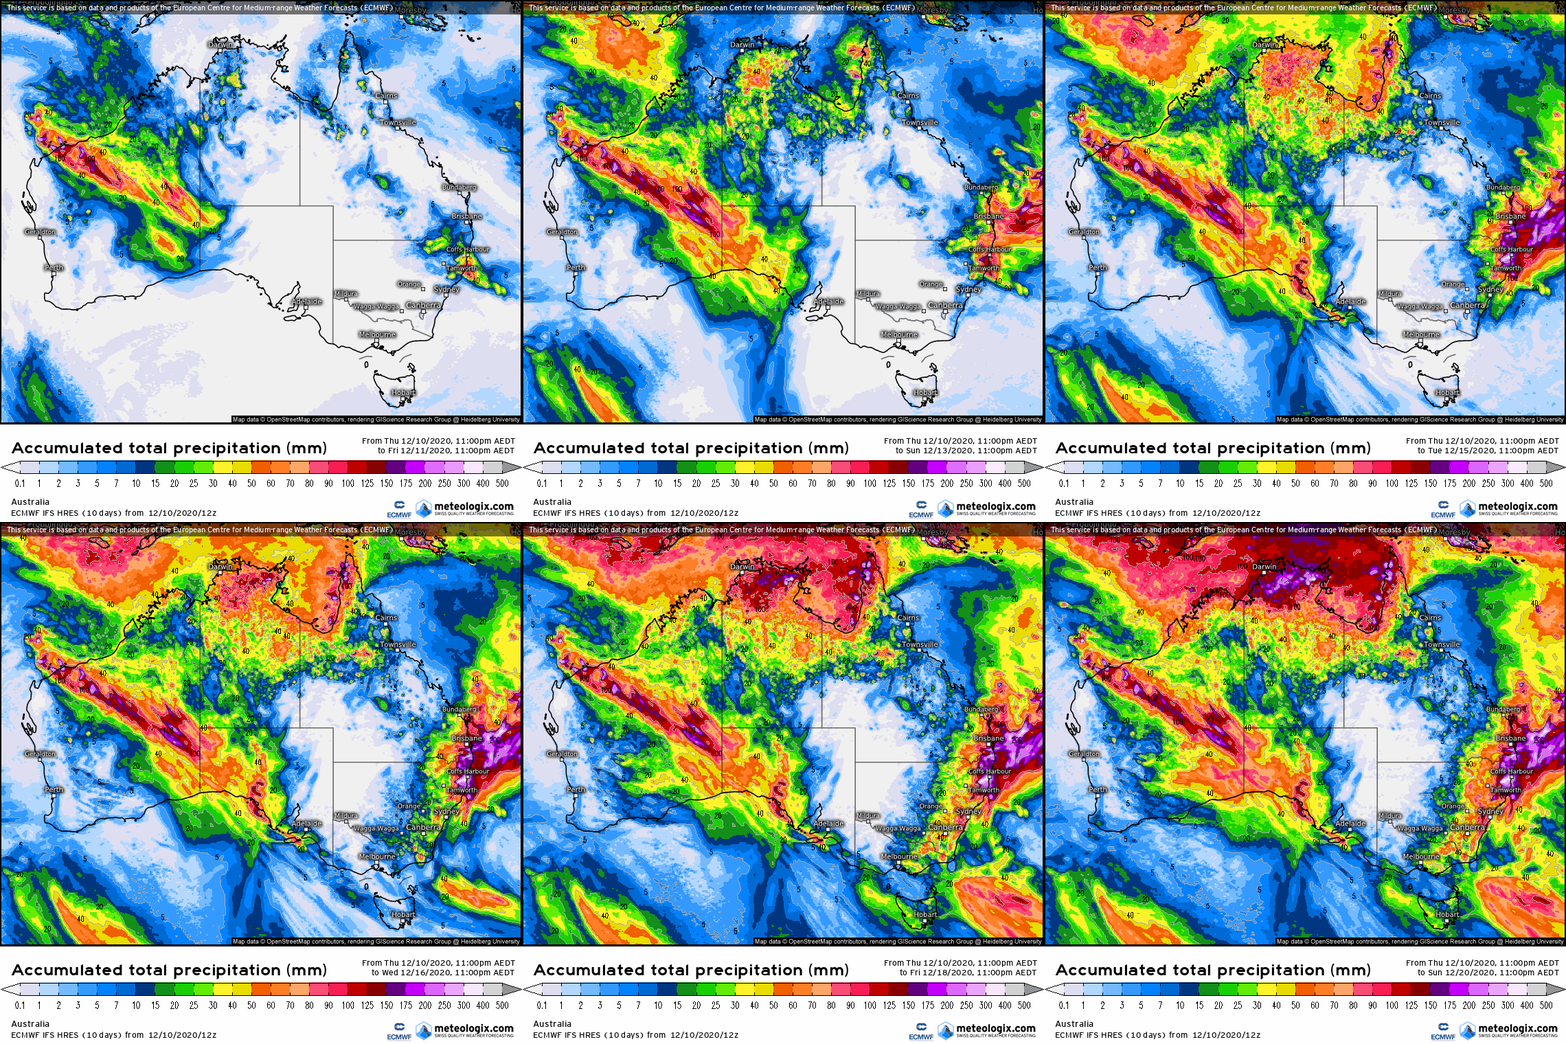
9-day ECMWF rainfall outlook

Fresh today, the European ECMWF 9-day model shows rainfall deepening into desert areas of Western Australia with a weak pulse of the MJO now in Phase 5 in Australia’s north-west. The rainfall situation is set to become more interesting in the next fortnight as the MJO is anticipated to strengthen as it propagates further eastward towards the Pacific Ocean.

Refreshed multi-week models are consistently showing cool, wet conditions for NSW and Qld areas right through until 3 January 2021, so the La Niña might be turning up after all.

More details in next Fridays fortnightly analysis.

Access courtesy https://meteologix.com/au

modez_20201210_2300_animation.gif

In case you missed it - Summer seasonal outlook Podcast

Last week, we congregated in the Narrabri Max FM community radio studios to record our take on what’s going on with the climate at the moment and the outlook for the next 3 months of summer.

To access the 11-minute recording, click here: 👉 https://player.whooshkaa.com/episode?id=765308

For those interested, the IPO poster (image below) mentioned in the podcast can be found here:

https://www.longpaddock.qld.gov.au/rainfall-poster/map-app/

Ad for LinkedIn and social.png

IPO.png

Climate in-brief

  • A moderately active MJO pulse is making its way eastwards along the equator towards Australia’s north, which has been difficult to track on the spider diagram “Evaluation of individual circulation and convective variables supports a robust MJO over the Maritime Continent” (NCEP 1 Dec).

  • The Southern Annular Mode is back above zero, and is predicted to stay in the positive (wet) phase in the coming fortnight - assisting moisture flow through NSW and S Qld areas.

  • Anomalous high pressure has been the feature off eastern Australia over the last month, with many eastern locations achieving decile 1-2 November rainfall (see map opposite and bottom right).

  • Multi-week models showing consensus for a more general wetter-than-normal period 11-31 December. Shorter-term guidance is showing little enthusiasm for general rain events at this stage - staying in touch with information when it comes to hand will be critical in the coming days

  • Temperatures to remain around normal or cooler for December, with recent heat wave activity abating.

The chart above shows higher-than-normal air pressure across eastern/northern Australia for the last 30-days.

The chart above shows higher-than-normal air pressure across eastern/northern Australia for the last 30-days.

Australian weekly rainfall and relative landscape water balance

Some handy falls in northern NSW and border rivers overnight. Isolated patchy falls elsewhere in S Qld, the big rivers area of NT and Kununurra also. http://www.bom.gov.au/australia/flood/?ref=ftr

Some handy falls in northern NSW and border rivers overnight. Isolated patchy falls elsewhere in S Qld, the big rivers area of NT and Kununurra also. http://www.bom.gov.au/australia/flood/?ref=ftr

November rainfall decile map shows a sorry tale of dry weather during La Nina 2020 - perfect for grain harvest, although summer crop and livestock producers would beg to differ.Australian decile map courtesy http://www.bom.gov.au/climate/maps/rainfa…

November rainfall decile map shows a sorry tale of dry weather during La Nina 2020 - perfect for grain harvest, although summer crop and livestock producers would beg to differ.

Australian decile map courtesy http://www.bom.gov.au/climate/maps/rainfall/?variable=rainfall&map=decile&period=month&region=nat&year=2020&month=11&day=30

Climate drivers - update

climate drivers.png

The story of this fortnight is the SAM and MJO finally going to script in-line with the La Niña signal. The air pressure at Darwin is below normal (1007 hPa) and the SOI has returned to above +8 a threshold for La Niña conditions. With a week-moderate MJO pulse approaching to the north of Australia, drivers look as primed as they have been for months to introduce the 2020 La Niña to many areas of eastern Australia in December, so far untouched.

What to know about the climate drivers and how they are measured? Click here

Monitoring the SAM

The SAM has bounced around a bit lately, but the outlook for the next 14-day period looks much more settled into a positive (wet) phase (above the dotted black line). This is good news and timely, with an approaching MJO.

Antarctic Oscillation or SAM values (4 Dec)

Recent research by Hendon et al, (2014) at the Centre for Australian Weather and Climate Research found the Southern Annular Mode to be the leading mode of circulation variability through parts of inland eastern Australia where cotton is grown; particularly in the spring planting period.
 
A positive SAM has been proven to increase moisture supply into fronts and troughs forming in eastern Australia. The chart provided by Climate Prediction Center (US) shows the most recent observations of the SAM or (AAO). 

A negative SAM traditionally leads to a dry westerly circulation pattern through eastern Australian cropping areas.
 
BOM researchers Lim and Hendon (2013) found the SAM has the strongest connection with El-Niño Southern Oscillation in October and November – whereby the SAM is influenced most by El Niño or La Niña conditions.

Growers and advisors are encouraged to monitor the phases of the SAM together with seasonal forecasting, multi-week and short term weather models during planting. A short cartoon explaining the SAM can be found HERE

Global tropical hazards

(from U.S Climate Prediction Center)

Some action in the tropics at last! The noticeable features in the chart below show a potential cyclone development in the western Timor Sea and above normal rainfall for the Qld gulf and tropical coast next week (bottom chart).

Jason Nicholls (@jnmet) at ACCU weather reports this morning, the potential cyclone development occurring 7-12 December in Australia’s north-west.

accu weather TCs.png

Chart of the Week - water vapour prediction (Sat-Tue)

The water vapor content of the atmosphere is of critical importance to nearly every facet of atmospheric science. Observing the processes that determine the water vapor content of the atmosphere is, therefore, of fundamental importance. As the earth’s surface is the source of most atmospheric water vapor, observations of vertical turbulent transport of water vapor in the planetary boundary layer have been the subject of many research projects. Evapotranspiration can vary significantly across the earth’s surface due, for example, to variability in insolation, vegetation cover, soil properties, and precipitation. Area-averaged water vapor flux measurements are necessary to get a large-scale view of surface–atmosphere interactions. 

The Extreme Forecasting Index (EFI) is an integral measure of the difference between the ensemble forecast (ENS) distribution and the model climate (M-climate) distribution. This allows the abnormality of the forecast weather situation to be assessed without defining specific (space- and time-dependant) thresholds. The EFI takes values from -1 to +1. If all the ensemble members forecast values above the M-climate maximum, EFI = +1; if they all forecast values below the M-climate minimum, EFI = -1. Experience suggests that EFI magnitudes of 0.5 - 0.8 (irrespective of sign) can be generally regarded as signifying that "unusual" weather is likely whilst magnitudes above 0.8 usually signify that "very unusual" weather is likely. Although larger EFI values indicate that an extreme event is more likely, the values do not represent probabilities as such. 

Let’s hope the high levels of atmospheric water vapour can flow through to precipitation in parched N NSW and S Qld areas (image courtesy ECMWF).

Summer seasonal outlook - Podcast out now!

Earlier this week, we congregated in the Narrabri Max FM community radio studios to record our take on what’s going on with the climate at the moment and the outlook for the next 3 months of summer.

To access the 11-minute recording, click here: 👉 https://player.whooshkaa.com/episode?id=765308

For those interested, the IPO poster (image below) mentioned in the podcast can be found here:

https://www.longpaddock.qld.gov.au/rainfall-poster/map-app/

Ad for LinkedIn and social.png

IPO.png

9-day ECMWF rainfall outlook

Fresh today, the European ECMWF 9-day model shows rainfall deepening into desert areas of Western Australia with the MJO approaching. Kununurra, Katherine and Gulf areas should see a break in the next week or so. Some moisture also filtering down the Qld coast and scattered areas of NSW inland and ranges. Date range: 3rd - 13th December.

Updated multi-week models are still bullish this morning for a general rain event December weeks 2-4, consistent with the last fortnight.

Access courtesy https://meteologix.com/au

modez_20201203_2100_animation.gif

Windy.com a neat weather website & app

www.windy.com was a subscriber suggestions for our review… we are not quite sure why we didn’t already know about this one! A free yet comprehensive website and app - if you have time to browse through windy.com it has so much more to offer than just wind detail.

windy.png

Features:     windy.com has a whopping 47 climate overlays on its maps. Temperatures, precipitation, humidity, air pressure and even paragliding spots (it that’s what you are in to) just to name a few apart from wind speed & direction.

Data is from two of the leading global climate models GFS & ECMWF. You can choose which model you are viewing and easily switch between the two for a simple comparison.

Precipitation forecasts are displayed as an accumulation for various periods; 12 hours, 24 hours, 3, 5 and 10 days.

10 day precipitation ACCUMULATION forecast by ECMWF

10 day precipitation ACCUMULATION forecast by ECMWF

A neat radar that presumably uses the BOM radar network, shows rainfall and lightning activity in a modern display.

Radar zoom.png

Pros: Free, detailed and accurate forecast maps from go-to leading global climate models such as ECMWF. The home page on the app gives a fantastic visualisation of what’s going on.

Cons:          Due to the immense detail, some of the menu’s are difficult to read on a device. Additionally, there does
not seem to be a way to save user preferences.

1. Windy.com on the App store 2. The home page with a simple forecast for your current location 3. Heat forecast map

1. Windy.com on the App store
2. The home page with a simple forecast for your current location
3. Heat forecast map

Overall:        An excellent resource for current and forecast weather conditions. I’d preference the desktop version to take in the
detail, however the app is very useful too.

Cost:           FREE

All images for this review are shown for the free version. Upgrading to premium version for USD $20.89 / year gives you higher resolution 1 hour forecast maps (rather than the three hours in the free version). Data that is updated 4 time a day (rather than 2) and technical support. All versions of Windy.com are currently advertisment for free, however during 2021 you’ll start to see targeted advertising.

Not all the overlay options fit on the screen - this is most of them!!

Not all the overlay options fit on the screen - this is most of them!!

Monitoring heat waves this summer

About heat waves

Heatwaves are calculated using the forecast maximum and minimum temperatures over the next three days, comparing this to actual temperatures over the previous thirty days, and then comparing these same three days to the 'normal' temperatures expected for that particular location. Using this calculation takes into account people's ability to adapt to the heat. For example, the same high temperature will be felt differently by residents in Moree compared to those in Orange, who are not used to the higher range of temperatures experienced in Moree. The full forecast can be accessed here: http://www.bom.gov.au/australia/heatwave/

The synoptic chart has a high east of Brisbane and one east of Tasmania, trapping heat from Australia’s red centre across NSW and Qld this week. Weeks 2-4 of December should see temperatures return to more average levels, once this passes.

Heatwave forecast starting Sunday 29 November through to Tuesday 1 December 2020

9-day ECMWF rainfall outlook

Fresh today, the European ECMWF 9-day model shows rainfall for the next week mainly confined to Katherine, Kununurra, the parched northern NSW tablelands and a few handy falls further south at the end of the forecast loop. Date range: 26th November - 6th December.

Updated multi-week models are still bullish this morning for a general rain event December weeks 2-3, and a return to more normal temps for the remainder of the month. A full review next Friday.

Access courtesy https://meteologix.com/au

9 day ecmwf.gif

Climate in-brief

  • Australia has found itself hostage to anomalous high-pressure (chart adjacent), with very little moisture transport from the tropics to inland areas, with the exception of isolated pockets along the coastline

  • The Southern Annular Mode has tanked negative, which will not assist moisture inflow to central-eastern areas during the remainder of November, but the SAM is expected to move more positive (wet) in December

  • With a benign MJO, very little tropical activity and subsequent cyclonic activity, however, the air pressure at Darwin has fallen to well below average this week

  • Multi-week models showing consensus for a more general rain event ~4-14 December where guidance suggests the current stronger than normal air pressure anomaly will abate - enabling easterly moisture penetration into NSW and Qld

  • Temperatures to remain around normal for the remainder of November, and

  • Seasonal models for summer season not showing consensus for a typical La Niña rainfall signature, as some caution is recommended for N NSW and SE Qld areas, with the eastern half of Qld and SE NSW showing the most potential for higher-than normal rainfall.

The chart above shows higher-than-normal air pressure across eastern/northern Australia. The low pressure associated with the MJO has not propagated eastward, with cyclonic activity centred in the Bay of Bengal and western Indian Ocean.

The chart above shows higher-than-normal air pressure across eastern/northern Australia. The low pressure associated with the MJO has not propagated eastward, with cyclonic activity centred in the Bay of Bengal and western Indian Ocean.

Australian weekly rainfall and relative landscape water balance

Some handy falls in the big rivers area of NT and the gulf over the past week and smaller scattered totals elsewhere along the coast and ranges. http://www.bom.gov.au/jsp/awap/rain/

Some handy falls in the big rivers area of NT and the gulf over the past week and smaller scattered totals elsewhere along the coast and ranges. http://www.bom.gov.au/jsp/awap/rain/

Water balance anomaly still shows a dry area in SW Qld, with areas along the NSW ranges still above average after reasonable october totalsAustralian relative landscape water balance ‘upper soil’ courtesy BOM

Water balance anomaly still shows a dry area in SW Qld, with areas along the NSW ranges still above average after reasonable october totals

Australian relative landscape water balance ‘upper soil’ courtesy BOM

Multi-week model analysis (8-28 days)

Multiweek models.png

A signal coming through from the multi-week models for a general event around 4-14 December. With the MJO currently inactive, models seem to suggest the current high-pressure acting as an umbrella across eastern Australia will abate and moisture from the NW and NE can penetrate inland areas during the first half of December. Despite many areas will register low rainfall totals for November, big-picture drivers remain reasonably bullish (particularly for Southern NSW and NE QLD).

horse-race-silhouette-3.png

Model commentary: a surprise this morning to see the typically doomsday IRI model showing general moisture for the first half of December! The interesting feature of the JMA wet forecast was the easterly systems developing along the coast and ranges of NSW, which we’ve not seen since the Autumn. The 16-day NCEP is more of a ‘weather’ model and it was not too excited about anything much except rain in the Ord and Katherine areas. The BOMs ACCESS model has been off with the pixies since May, but now in-line with the other two multi-week models showing a wet first half of December, the next fortnight or so will be interesting to see how this pans out. Keep an eye on the Meteologix 10 day Forecast XL for a full summary of all ‘weather models’ as events draw closer for your area: https://meteologix.com/au

Monitoring the SAM

The SAM has retreated into negative territory this week, although it is forecast to recover to neutral phase for the remainder of the month. Climatologists expect the SAM to become entrenched in positive phase through summer, in line with the La Nina signal. Until this occurs with some consistency, it is difficult for farmers in NSW and S Qld to get too optimistic with hopes for a fairytale wet La Niña summer.

Antarctic Oscillation or SAM values (20 Nov)

Recent research by Hendon et al, (2014) at the Centre for Australian Weather and Climate Research found the Southern Annular Mode to be the leading mode of circulation variability through parts of inland eastern Australia where cotton is grown; particularly in the spring planting period.
 
A positive SAM has been proven to increase moisture supply into fronts and troughs forming in eastern Australia. The chart provided by Climate Prediction Center (US) shows the most recent observations of the SAM or (AAO). 

A negative SAM traditionally leads to a dry westerly circulation pattern through eastern Australian cropping areas.
 
BOM researchers Lim and Hendon (2013) found the SAM has the strongest connection with El-Niño Southern Oscillation in October and November – whereby the SAM is influenced most by El Niño or La Niña conditions.

Growers and advisors are encouraged to monitor the phases of the SAM together with seasonal forecasting, multi-week and short term weather models during planting. A short cartoon explaining the SAM can be found HERE

Global tropical hazards

(from U.S Climate Prediction Center)

The noticeable features in the chart below show the green colours in the Indian Ocean where the MJO currently resides, not really progressing eastwards towards Australia. When the tropical moisture in the Pacific begins to move Easterly (towards Australia), this will increase the probability of our cyclonic activity and rainfall.

Seasonal forecast: December 2020 - February 2021

Here are four of the major seasonal rainfall models showing for December, January, February.

The general circulation models (GCMs) are not exactly showing a conventional La Niña signature through central inland areas, instead favouring coastal Queensland, Cape York and SE corner of NSW. The cooler waters to Australia’s north and ever-persistent high-pressure systems in the Tasman Sea are perceived as having a negative influence on rainfall through central NSW through to the Darling Downs/Southern Qld.

Despite forecast rain for the first week in December, some caution is needed for northern NSW and southern Qld areas looking to plant summer crops or purchase livestock. The Southern Annular Mode has not progressed into a positive phase (in keeping with La Niña), which is likely flowing through into these model outputs and requires careful monitoring during the next few weeks.

What to know more about climate drivers and how they are measured? Click here

IRI%2Bseasonal.jpg

IRI MME (US)

BOM seasonal.png

BOM (AU)

ECMWF.png

ECMWF (EU)

CmCC.png

CMCC (ITA)

Farmer climate focus - Nigel Burnett

Location_Map Emerald.png

Nigel and Beth Burnett run a mixed broadacre cropping farm near Emerald, QLD. With a mixture of both irrigated and rain grown cropping enterprises, the climate is a key management consideration. Nigel shares with us how he is preparing for an altered summer cropping program based on the favourable 2020-21 outlook.

fullsizeoutput_240c5.jpg

Nigel Burnett

Emerald, Qld

Location snapshot

Catchment:   Fitzroy Catchment (Comet River sub basin and Nogoa River sub basin)

Altitude:        156m

Enterprise:    Broadacre cropping (irrigated & dryland).
Winter cereals and legumes, Summer (Cotton and sorghum)

Rainfall:        Wet season (Oct-Mar): 76% rainfall
Cool season (Apr-Sep): 24% rainfall

Seasonal rainfall climate drivers: Niño 4 ocean indicator seems to be the one to watch for Emerald

El Nino-Southern Oscillation (ENSO) is the key climate driver, however, ENSO impacts are very weak post-January to May.

Very little impact from the Indian Ocean dipole in this location - strongly ENSO related climate influences

Very little impact from the Indian Ocean dipole in this location - strongly ENSO related climate influences

fullsizeoutput_1d42f.jpeg

What are your ‘go-to’ sources of climate/weather information?

OCF and OzForecast for weekly weather forecast. Jon Welsh’s seasonal climate analysis, WXMAPS (GFS) for a broad picture of what's going on and the BOM to round it all out.

How do you consider climate in your farm management? Consideration of climate plays a big part in our farm management strategy. It is a key driver in our decision making and is integral to our risk management strategy. We use it mainly to get a feel for where things are heading in terms of our seasonal outlook for our region and the rest of the Eastern cropping zone. The weather conditions we receive during fallow and in-crop are out of our control, but we can manipulate our production system to maximise the opportunity provided by a favourable seasonal outlook or manage our exposure to risk from a poor seasonal outlook. Some of the management decisions which we make to respond to the climate outlook are planting decision, planting timing, rotation, variety and maturity, fertiliser program and stubble management.

IMG_2858.JPG

Can you share a climate success (or failure) story with us?

I was on the Cotton Industry Awards judging trip in April of 2016 and and was fortunate to spend some time discussing the seasonal outlook with Jon Welsh on our visit to Narrabri. Jon was very bullish on the rainfall outlook for winter for the whole eastern cropping zone and after analyzing other climate forecasts and considering other important management drivers, I came back to Emerald and planted wall to wall chickpeas including all of our irrigated fields. Luckily this turned out to be a very good decision as that winter was very favourable in terms of rain and temperature. It was easily our most profitable winter crop that I can remember growing ever. Now I am sure Welshy will be the first to advocate not to plant your whole farm to one particular crop on his advice of an improvement in the seasonal condition. But it was a very important consideration among other drivers such as soil moisture, commodity price, water availability for irrigation and cash flow.

There was early talk of a wetter winter, however you haven’t received much rain after your wetter than average Feb/Mar. How did your winter crop pan out?

Our area certainly missed the wetter winter memo and it has been a tough winter cropping season for Central Queensland. We planted 3000Ha of wheat and chickpeas on predominantly rain grown country and a small amount of semi irrigated wheat. Our team had to chase moisture deep for planting the wheat and the chickpeas using a moisture profile from the last significant rainfall from late February/ early March. The profile wasn't consistent and plant stand wasn't ideal, further contributing to the effect of the tough season on the very average yields. However, even with the benefit hind sight, I would still plant those crops for the new crop stubble benefit. 

fullsizeoutput_1a032.jpeg

What are you thoughts for this summer crop?

We have received 50-60mm in the last week of October across our entire area and with the improved seasonal forecast we are feeling more and more optimistic by the day. If the rain continues and we fill our soil profile during November, we will plant a significant portion of our area to irrigated and rain grown cotton. Although August has become the preferred option to plant irrigated cotton in our region, I think there is still enough time to grow a good crop of cotton in CQ that is planted in November and harvested in May.

Have a farming climate story to share? Please contact us.

9-day ECMWF rainfall outlook

Fresh this morning, this European model shows rainfall for the next week mainly confined to Katherine, Kununurra and the parched NSW northern ranges. Some handy falls possible along the Great Dividing Range further south. Date range: 26th November - 6 December.

The remainder of December looks interesting. Air pressure at Darwin is now at 1005 hPa, which is well below average - exhibiting monsoon-like characteristics. The bug-bear at the moment is cooling sea temperatures around the Arafura and Coral Seas, not consistent with a La Niña like conditions. In turn, the MJO is losing steam when it comes from west-east and arrives in the Australian region. The latest multi-week models are still bullish for a general change and rain week 2-3 (coinciding with a weak MJO) of December and a return to average temps.

Access courtesy https://meteologix.com/au

9 day ecmwf.gif

Analysis - stratospheric cooling over Antarctica: a closer look

The Southern Annular Mode (SAM) index has finally broken through into positive phase over the last week, which could affect weather patterns in eastern Australia during the coming months.

The SAM is an index that measures the north-south displacement of a band of westerly winds flowing between Australia and Antarctica. 

When the SAM index is negative, these westerly winds move towards Australia and when it is positive, they contract towards Antarctica.

The positive phase of the SAM is linked to the stratospheric cooling over Antarctica, which made headlines last year for extreme warming (Left graph) relating to a negative SAM, not seen since the horrible drought year of 2002. The circle showed “çoupling” with the troposphere, which is where the SAM is measured and consequently, spent the rest of the year in a negative phase.

The second image (Right graph) shows the current - and very opposite situation. Stratospheric cooling has just “coupled” with the SAM, showing the cooling (blue) colours right through different heights of the atmosphere.

What does this mean? Stratospheric cooling (or warming) was found by Hendon et al (2020) to have a connection with the SAM. It’s anticipated that the SAM will be positive during La Niña, but this analysis does provide added confidence. A positive SAM occurs when the winds in the southern ocean contract (last image), allowing more tropical moisture to move south into the mid-latitudes increasing the chance of late spring and summer rain. SAM moving back into positive territory is a good sign for rainfall on summer pastures and crops from NSW through to the northern Darling Downs.

Want to learn more about SAM - watch this 2 minute youTube video

Spring 2019 - sudden stratospheric warming (top) and SAM (below). Last years event was the most extreme event not seen since 2002.

Spring 2019 - sudden stratospheric warming (top) and SAM (below). Last years event was the most extreme event not seen since 2002.

Current (Nov 2020) chart showing stratospheric cooling (top), coupling with a positive SAM (below).

Current (Nov 2020) chart showing stratospheric cooling (top), coupling with a positive SAM (below).

 
The winds in the Southern Ocean contract further south, enabling tropical La Niña moisture to reach the mid-latitudes.

The winds in the Southern Ocean contract further south, enabling tropical La Niña moisture to reach the mid-latitudes.