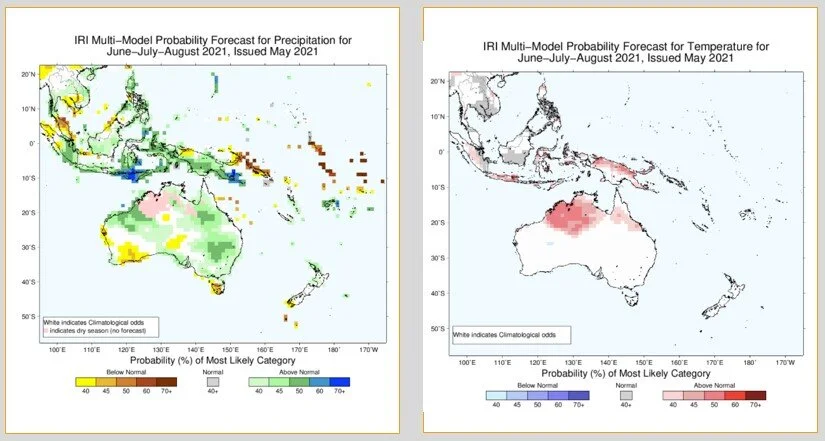
A survey of 12 international models condensed in the below charts (top both and bottom LHS) shows the outlook for late winter early spring rain sitting in the upper level of probabilities. The BOMs ACCESS model is showing “Anthony Mundine” like confidence in its predictions for some eastern locations, whereas the group of European multi-model is more conservative. With more certainty on the path of key drivers: IOD and Modoki this month, those who have decisions to make in the spring should be running this very wet scenario in their businesses. No extreme temperatures predicted is a salient point, as we know heat can undo an erratic wet forecast coming into spring.
See the bottom chart for the IRIs refreshed early spring outlook!
Order of Figures clockwise from top left: ACCESS-S tercile forecast, CS3 multi-model tercile (ECMWF, UK, France, Italy, US, Japan), 5x North American models combined on the bottom showing rainfall (LHS) and temperature (RHS). IRIs extended outlook at the bottom.