Analysis - Sea Surface Temperature Distributions 2010 v 2020 La Niña's
/December 2010 Sea Surface Temperatures and rainfall deciles

Record warm sea surface temps around Australia’s north and the Maritime Continent

With the exception of a small strip, record rainfall through eastern Australia in that month
December 2020 Sea Surface Temperatures and rainfall outlook (21 Dec 2020 - 3 Jan 2021)

SSTs as of 11 December 2020 (tropicaltidbits.com)

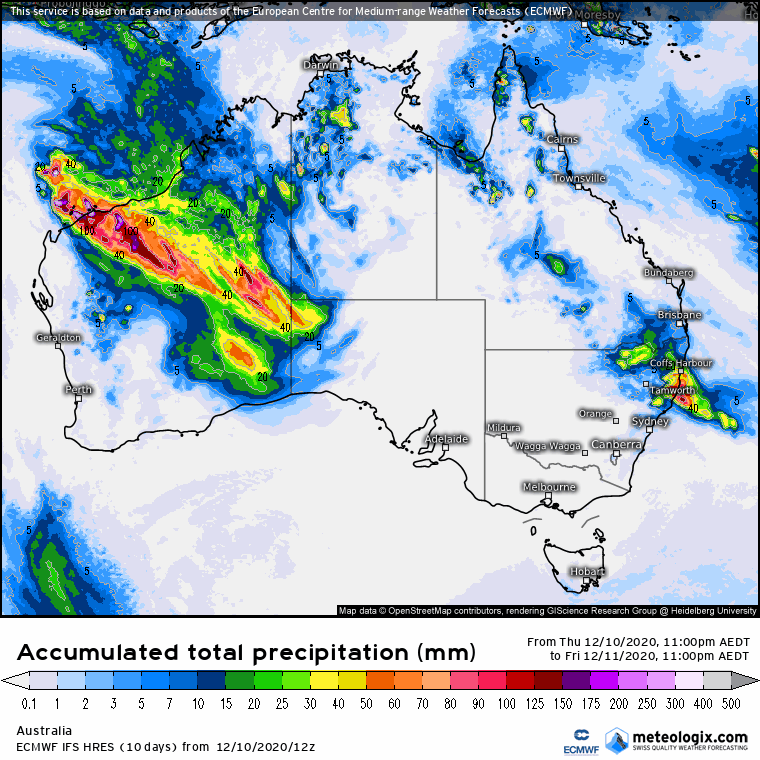
Fortnightly precipitation forecast 21 Dec-3 January 2020 (courtesy BOM 10 December).
So what?
The La Niña signature can be clearly seen in both images, with cool water extending into the western Pacific Ocean. Models are anticipating the Coral Sea to warm and deliver rainfall to eastern Qld areas (although the latest 7-day change maps on tropicaltidbits.com would suggest otherwise). The waters around the Maritime Continent are not near as warm as 2010. The next research article suggests that we need these waters, and those to the east of Australia to be much warmer to supply rainfall events this summer - this warming may well happen in the next month or so.