Climate in-brief
/The latest multi-week model survey shows NSW as the main beneficiary for July rainfall, with other Qld and tropical areas likely to be average, or drier than normal.
A review of seasonal model prediction in March for the season ahead shows temperature predictions were reasonably accurate. Rainfall forecasts were limited in their usefulness during the period.
Stored soil moisture continues to reach capacity in many east-coast catchments after recent rainfall as any future falls increasingly likely to run water into dams and rivers.

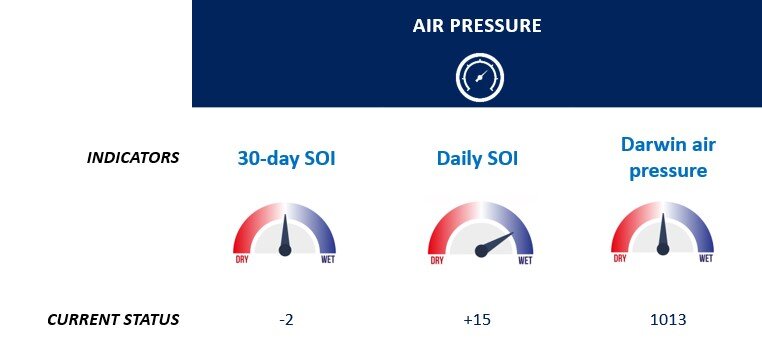
The chart above shows a large area of high pressure circulating moisture anti-clockwise into the Australian region. A hint of the atmosphere coupling with a wet Indian Ocean Dipole in that region worth pointing out.
Australian daily and weekly rainfall observations

Some handy falls in the channel country and inland NSW. Overnight figures not updated yet. Go to the link below this afternoon for new numbers:

Weekly rain saw moisture finally arrive through western Qld and continued falls in NSW MDB and ranges.
Australian 7-day rainfall map courtesy http://www.bom.gov.au/climate/maps/rainfall/?variable=rainfall&map=totals&period=week®ion=nat&year=2020&month=12&day=17