Climate in-brief

  • The latest multi-week model survey shows NSW as the main beneficiary for July rainfall, with other Qld and tropical areas likely to be average, or drier than normal.

  • A review of seasonal model prediction in March for the season ahead shows temperature predictions were reasonably accurate. Rainfall forecasts were limited in their usefulness during the period.

  • Stored soil moisture continues to reach capacity in many east-coast catchments after recent rainfall as any future falls increasingly likely to run water into dams and rivers.

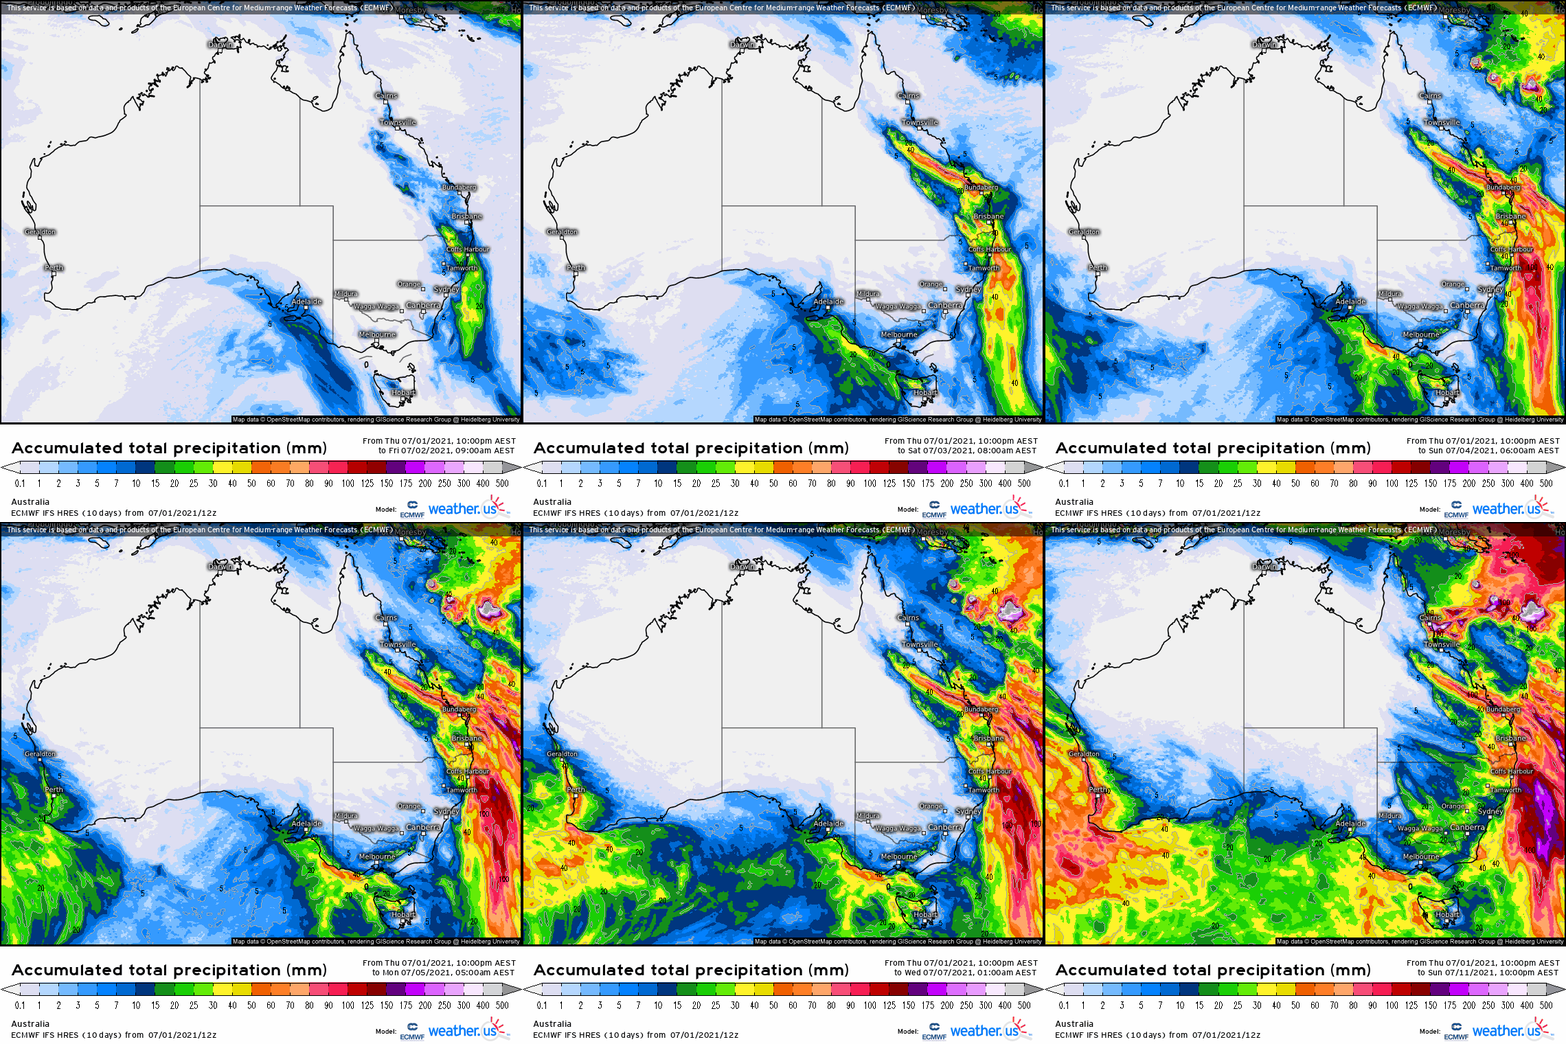
The chart above shows a large area of high pressure circulating moisture anti-clockwise into the Australian region. A hint of the atmosphere coupling with a wet Indian Ocean Dipole in that region worth pointing out.

The chart above shows a large area of high pressure circulating moisture anti-clockwise into the Australian region. A hint of the atmosphere coupling with a wet Indian Ocean Dipole in that region worth pointing out.

Australian daily and weekly rainfall observations

Some handy falls in the channel country and inland NSW. Overnight figures not updated yet. Go to the link below this afternoon for new numbers:tp://www.bom.gov.au/australia/flood/?ref=ftr

Some handy falls in the channel country and inland NSW. Overnight figures not updated yet. Go to the link below this afternoon for new numbers:

tp://www.bom.gov.au/australia/flood/?ref=ftr

Weekly rain saw moisture finally arrive through western Qld and continued falls in NSW MDB and ranges.Australian 7-day rainfall map courtesy http://www.bom.gov.au/climate/maps/rainfall/?variable=rainfall&map=totals&period=week&region=nat&year=2020&month=12&day=17

Weekly rain saw moisture finally arrive through western Qld and continued falls in NSW MDB and ranges.

Australian 7-day rainfall map courtesy http://www.bom.gov.au/climate/maps/rainfall/?variable=rainfall&map=totals&period=week&region=nat&year=2020&month=12&day=17

Multi-week planner (8-28 days)

The Tropical Hazards map shows the passing MJO to Australias north generating rainfall across the Maritime Continent, with no influence on tropical mainland Australia during the next fortnight. Apart from warmer SSTs, it’s difficult once again to see supporting fundamentals for the BOMs extremely bullish wet July forecast (bottom chart), as the SAM also retreats towards neutral. NSW look to be the most likely area to receive wetter than normal falls this month. Check your median totals for July, as northern regions favour this category. With the exception of the NT and Ord, temperatures will likely remain normal also.

Multiweek models.jpg

Model commentary: A quick look at the bookmaker's selections from a fortnight ago shows the US colt, NCEP first past the winning post with pre-race tactics and sticking to the rails over the distance paying dividends. The JMA also showed similar national pride with a stellar gallop on a wet track, true to form. The media hype around the ACCESS-S gelding showed glimpses of form with punters now a little more confident in the mount after recent surgery. Normally solid performing US mare IRI was more cautious before the race and sat mid-field throughout and failed to fire in the straight.

Go to 10-day Forecast XL for a full summary of all ‘weather models’ as rain events draw closer for your area: https://meteologix.com/au

BOM.jpg

Monitoring the SAM

The SAM has been strongly positive through June, pushing moisture into eastern Australian productive agricultural areas. The guidance below expects the SAM to retreat back into neutral levels, so it looks unlikely to influence our climate in the next fortnight at least.

Now we are in winter its time to start monitoring the SAM again. When the SAM is negative, winds from Antarctica blow further north up into southern Australia. When the SAM is positive, these winds pull back towards Antarctica, allowing moisture from the tropics to push into Qld and NSW. The SAMs main influence is in spring and summer, but it is worth keeping an eye on to help us ground-truth model guidance when we see a change. A really good video at the bottom of this article will help explain this a little better.

Antarctic Oscillation or SAM values (2 July)

Recent research by Hendon et al, (2014) at the Centre for Australian Weather and Climate Research found the Southern Annular Mode to be the leading mode of circulation variability through parts of inland eastern Australia where cotton is grown; particularly in the spring planting period.
 
A positive SAM has been proven to increase moisture supply into fronts and troughs forming in eastern Australia. The chart provided by Climate Prediction Center (US) shows the most recent observations of the SAM or (AAO). 

A negative SAM traditionally leads to a dry westerly circulation pattern through eastern Australian cropping areas.
 
BOM researchers Lim and Hendon (2013) found the SAM has the strongest connection with El-Niño Southern Oscillation in October and November – whereby the SAM is influenced most by El Niño or La Niña conditions.

Growers and advisors are encouraged to monitor the phases of the SAM together with seasonal forecasting, multi-week and short term weather models during planting. A short cartoon explaining the SAM can be found HERE

Analysis: Apr-Jun season predictions v observations

A look back to mid-March 2021 at the seasonal forecast issued for Apr-Jun showed a wet signal very for the top end, based on the warm Arafura Sea and Ningaloo Region off the WA coast. The BOM model hosed down expectations with a neutral forecast for all other areas, which was pretty close. The IRI model was picking up activity in eastern NSW as was the European CS3 group of models, which did occur in a few pockets. None of the predictions picked up the broad-scale decile 2-3 rainfall across 50% of the continent, although temperatures were reasonably close to what was predicted. None of the models really nailed it through this period but this also highlights the difficulties when the climate drivers are finding their feet. The trophies stay in the cabinet again this month!

Apr-Jun rain (LHS) and temp (RHS) deciles

Apr-Jun rain (LHS) and temp (RHS) deciles

March forecast.jpg

Monitoring soil moisture this winter cropping season

A glance at the root zone moisture from the BOMs water balance model shows continued improvement through western Qld, although soil moisture in the WA region has worsened in the last fortnight. The Murray-Darling Basin looks primed for a flood, with all at capacity except the far north sitting on average.

Source: http://www.bom.gov.au/water/landscape/#/sm/Relative/day/-28.4/130.4/3/Point////2021/6/3/

Rootzone soil moisture 1 July

soil water.jpg