Climate in-brief
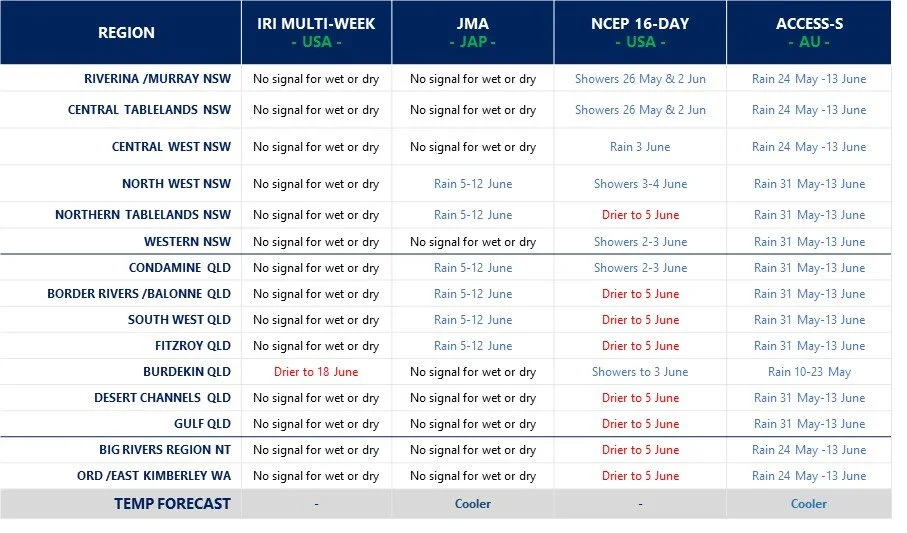
/Models divided on the June outlook following handy falls through NSW and eastern Qld in the last few days.
The remainder of June is shaping up as more in line with climatology (average rain/temp statistics) despite the BOMs access model showing an emphatic wet signal across large areas for the second fortnight in a row.
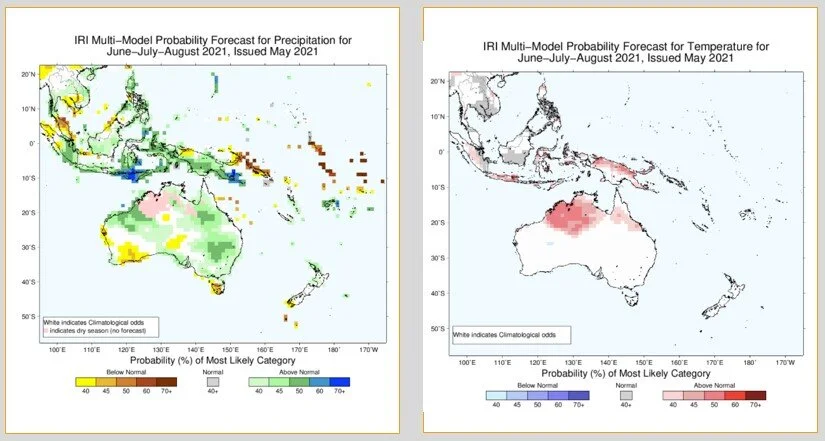
A look back on the international seasonal model guidance against Autumn precip and temp observations found accuracy with a general wet theme for Australia, however none of the models surveyed captured the conditions accurately across the forecast area.

The chart above shows the intense high pressure over Australia easing in the last 7-days with more normal air pressure. Encouraging to see low air pressure in the eastern Indian Ocean as the dipole commences its life cycle for 2021.
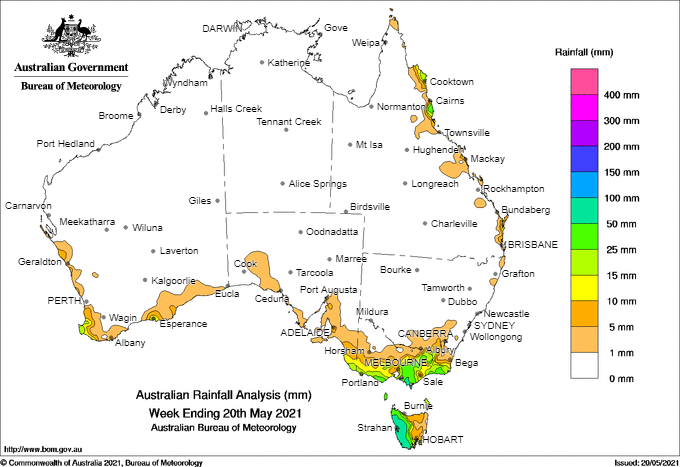
Australian daily and weekly rainfall observations

Localised falls of ~50mm in the last 48 hrs through eastern parts. tp://www.bom.gov.au/australia/flood/?ref=ftr

Weekly rain has favoured the Murray-Darling Basin. Note the falls from the 24hrs (left) have not been included in this chart yet.
Australian 7-day rainfall map courtesy http://www.bom.gov.au/climate/maps/rainfall/?variable=rainfall&map=totals&period=week®ion=nat&year=2020&month=12&day=17