Monitoring the SOI and Darwin barometric pressure
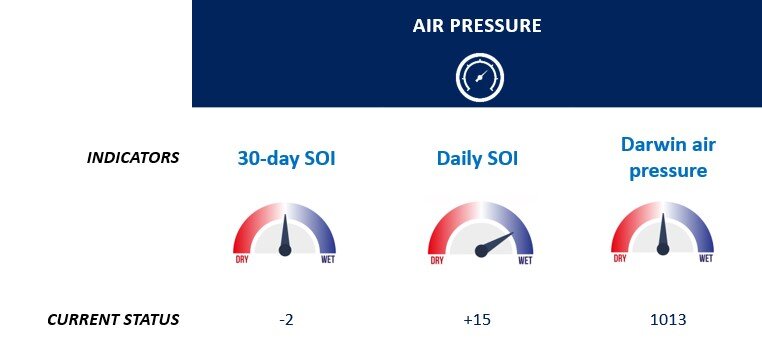
/The SOI has been dragging the chain from the wet signal relating to warm SSTs. The SOI has been below zero recently. The daily values show a climbing trend which will lift the 30-day average. The barometric pressure at Darwin is still only average. The take-home message is that the atmosphere is not supporting the theory from some model guidance (just yet) we should be preparing for prolonged wet conditions.
The Southern Oscillation Index or SOI is a standardised index of the barometric pressures over Darwin, Australia and Tahiti. Climate scientists use the SOI to assess the strength of the El Niño Southern Oscillation phenomenon (or ENSO), which in Queensland and NSW accounts for nearly 25 per cent of our year-to-year rainfall variability. For example, it is often wetter during a La Niña classified year (when the sustained SOI is very positive (higher than +7)) and drier during an El Niño classified year (when the sustained SOI is very negative (lower than -7)). The index scale ranges from about +35 to -35 using the Troup method of calculation used on Long Paddock.
In a recent Farmer Forecast interview with Prof. Toshio Yamagata, he encouraged us to also consider the barometric pressure at Darwin, for above/below average as a more useful proxy for air pressure, moisture transport and rainfall potential in our region. The reason being as this value is more representative of current conditions in the eastern Indian Ocean. See news article here: https://www.graincentral.com/weather/japanese-climate-pioneer-retraces-indian-ocean-dipole-influence-on-australian-agriculture/
Prof. Yamagata and his team published a journal article on their research in this area:
Behera, Swadhin & Yamagata, Toshio. (2003). Influence of the Indian Ocean Dipole on the Southern Oscillation. Journal of The Meteorological Society of Japan - J METEOROL SOC JPN. 81. 10.2151/jmsj.81.169.
Air pressure indicators 25 June 2021
Data courtesy https://www.longpaddock.qld.gov.au/soi/


