10-day rainfall outlook

Today’s 10-day ECMWF model loop favours smaller rainfall totals in the eastern half of NSW and C Qld. A quick run around the grounds this morning and we still have a split jury on the BOMs emphatic forecast wet July. The JMA and IRI refreshed outputs have a neutral-dry-ish theme for the next 10-28 days, with some light falls for NSW. More detail in next Fridays fortnightly climate wrap-up.

Keep an eye on https://meteologix.com/au for more site-specific analysis.

Image loop courtesy Meteologix

Image loop courtesy Meteologix


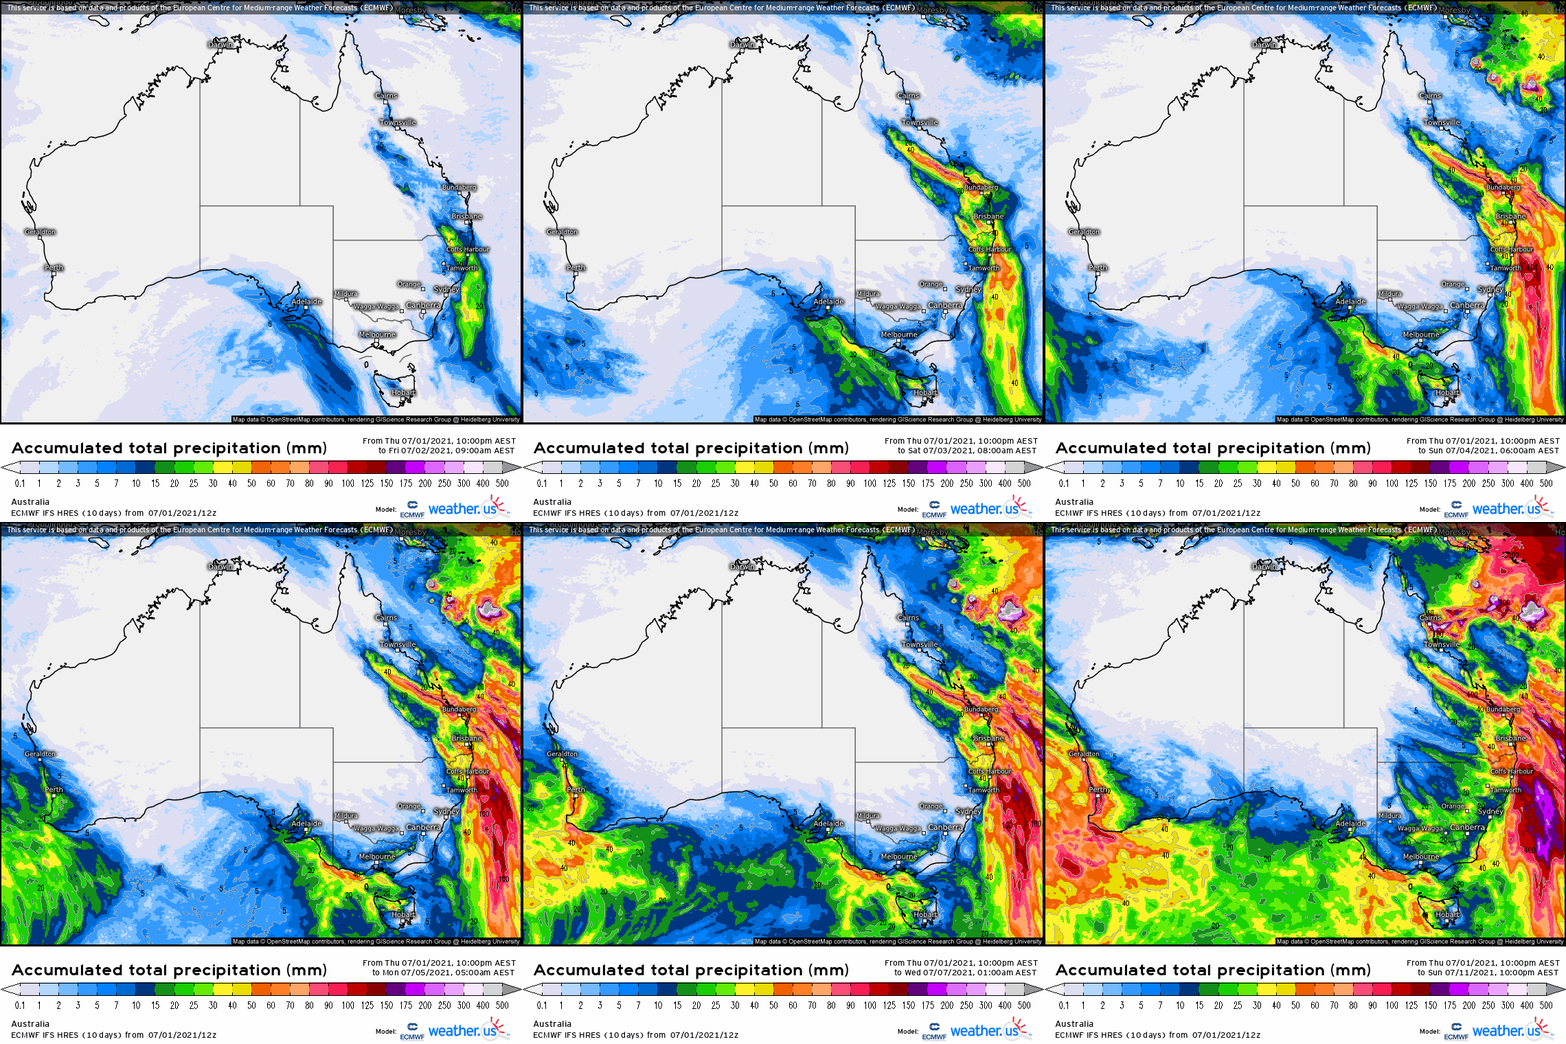
10-day rainfall outlook

Today’s 10-day ECMWF model loop is favouring the eastern half of NSW and Qld as the main rainfall beneficiaries. A look at the refreshed JMA, BOM and IRI weekly predictions show a wide model spread, consistent with the last 6 weeks. The BOM is still very excited about serious wet conditions for large areas - off the back of warm oceans around Australia. Again, none of the other globals are interested in anything other than patchy rainfall events (leading to average monthly totals) in the coming weeks. Click through next Friday for a more detailed multi-week analysis.

Keep an eye on https://meteologix.com/au for more site-specific analysis.

Image loop courtesy Meteologix

Image loop courtesy Meteologix


10-day rainfall outlook

Today’s 10-day ECMWF model loop shows most of the action in NSW and a system developing across central eastern Qld areas (later in the loop) that have been missing out. Could be an interesting month with quite a range of scenarios among models for the month of June. Weather models are much better at picking up rain-bearing systems originating from the east, as multi-week and seasonal models seem to struggle to accurately simulate these smaller, intense events.

Keep an eye on https://meteologix.com/au for more site-specific analysis.

Image loop courtesy Meteologix

Image loop courtesy Meteologix


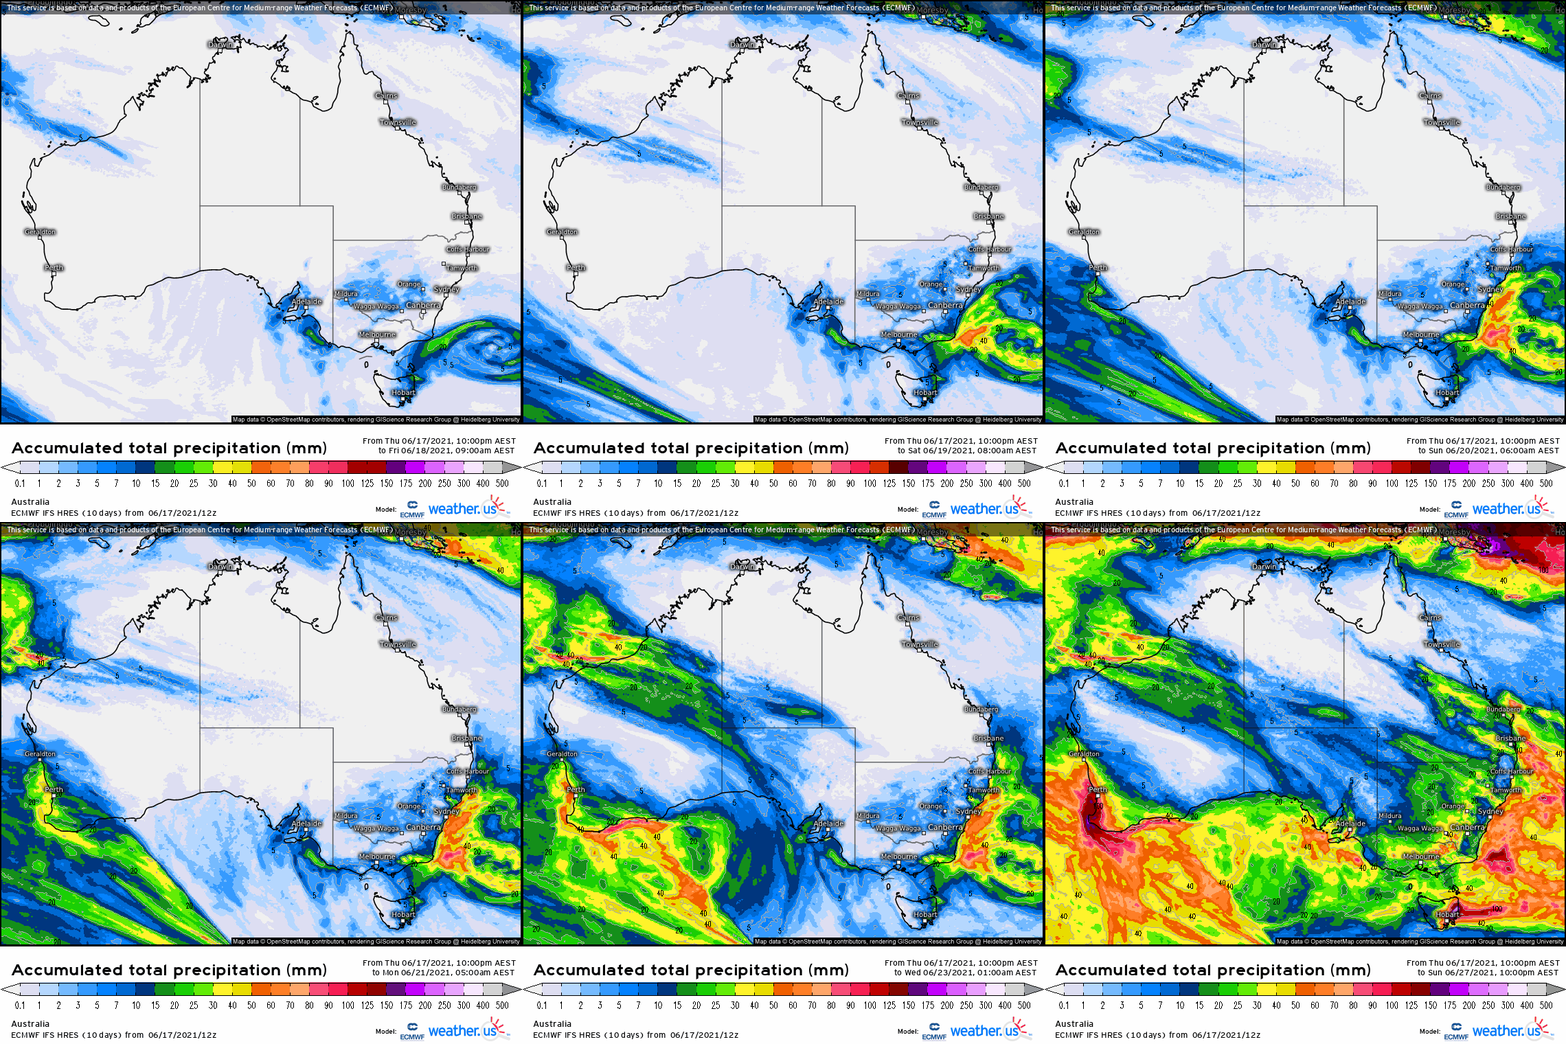
10-day rainfall outlook

Today’s 10-day ECMWF model loop shows most of the action in the west, with some light falls in eastern states at the end of the forecast loop. A quick look at the refreshed JMA model (IRI not updated) sees this pattern continuing and moisture moving across to central Australian areas, not quite making it to NSW and Qld now until the second half of June.

Keep an eye on https://meteologix.com/au for more site-specific analysis.

Image loop courtesy Meteologix

Image loop courtesy Meteologix


Monitoring the MJO this Autumn

The chart below shows the MJO currently in Phase 3 in the Eastern Indian Ocean, then moving quickly towards the Maritime Continent north of Australia in Phase 4 then disappearing into the circle (weakening). Each global model has a different take on the behaviour of the MJO as it reaches Indonesia. Most of the action appears to be along the equator and further north through this weak and erratic MJO event.

The Madden – Julian Oscillation (MJO) is a tropical disturbance that moves eastward around the global tropics every 30-60 days and has proven to influence rainfall and temperature conditions. The strength of the MJO may increase or decrease as it progresses eastwards, affecting the level of convection and influence on both precipitation and temperature. The diagram below is used by scientists to track the path of the MJO showing predicted dates through various phases (see December MJO explainer). A short YouTube cartoon explaining the MJO can be found here

Is there anything in this MJO event?

The chart below shows a weak pulse of the MJO in Phase 3 coming towards Australia (Phases 4-6) and the Maritime Continent. The Phase index shows a weakening (inside the circle) and the possibility of the MJO re-strengthening (green line) moving outside the circle. However, cloudiness and moisture are still set to arrive at the end of May and the start of June - bottom charts, red arrows (MJO analysis courtesy NOAA). In particular, cloudiness seems concentrated over the eastern Australian mid-latitudes.

The Madden – Julian Oscillation (MJO) is a tropical disturbance that moves eastward around the global tropics every 30-60 days and has proven to influence rainfall and temperature conditions. The strength of the MJO may increase or decrease as it progresses eastwards, affecting the level of convection and influence both precipitation and temperature. The diagram below is used by scientists to track the path of the MJO showing predicted dates through various phases (see December MJO explainer). A short YouTube cartoon explaining the MJO can be found here

 
This map shows clioudiness, not rainfall. Nonetheless, a key ingedient for precipitation! https://www.cpc.ncep.noaa.gov/products/precip/CWlink/MJO/mjoupdate.pdf

This map shows clioudiness, not rainfall. Nonetheless, a key ingedient for precipitation! https://www.cpc.ncep.noaa.gov/products/precip/CWlink/MJO/mjoupdate.pdf

The latest IRI multi-week model (this morning) shows moisture streaming across the desert during this MJO event.


10-day rainfall outlook

Today’s 10-day ECMWF model loop shows coastal systems dominating the next period. A dry outlook for most inland areas with a high-pressure ridge taking up residence. A hint of moisture creeping into the loop from the west on day 10 coinciding with the arrival of the MJO.

Keep an eye on https://meteologix.com/au for more site-specific analysis.

Image loop courtesy Meteologix

Image loop courtesy Meteologix


Monitoring the MJO this Autumn

The chart below shows a pulse of the MJO strengthening in Phases 1 and 2 out in the Western Indian Ocean and then losing strength as it approaches the Australian region in Phase 4. However, the bottom chart (courtesy NCEP expert MJO report on Tuesday) shows tropical convection and cloud in the Australian longitudes in the last week in May (red arrow). We should keep an eye on this as a potential window for moisture to penetrate south during that period.

The Madden – Julian Oscillation (MJO) is a tropical disturbance that moves eastward around the global tropics every 30-60 days and has proven to influence rainfall and temperature conditions. The strength of the MJO may increase or decrease as it progresses eastwards, affecting the level of convection and influence on both precipitation and temperature. The diagram below is used by scientists to track the path of the MJO showing predicted dates through various phases (see December MJO explainer). A short YouTube cartoon explaining the MJO can be found here

9-day rainfall outlook

Today’s 9-day ECMWF model loop shows a rain-bearing system developing across central eastern areas over the coming week or so. Very little to report for tropical areas, with the MJO approaching in Phases 2-3 one would expect that to be the case, with all the moisture being pulled away from the tropics towards the Indian Ocean.

Keep an eye on https://meteologix.com/au for more site-specific analysis.

Image loop courtesy Meteologix

Image loop courtesy Meteologix


9-day rainfall outlook

Today’s 9-day ECMWF model loop shows some convective moisture from the warm Ningaloo Reef region in W.A streaming across to NSW through the first week in May. Some rainfall also along the Qld coast. A quick glance at the refreshed IRI and JMA multi-week models and things are looking good with both keen on NSW and sth Qld receiving rain in the next fortnight!! More details on the May outlook next week.

Keep an eye on https://meteologix.com/au for more site-specific analysis.

Image loop courtesy Meteologix

Image loop courtesy Meteologix


Monitoring the MJO this Autumn

The chart below shows a pulse of the MJO strengthening in Phases 8 and 1 out in the Western Indian Ocean. The bottom chart shows the average conditions in those phases historically bringing dry weather. However, phases 4 and 5 look much more encouraging this time of year, so the MJO will be worth keeping an eye on.

The Madden – Julian Oscillation (MJO) is a tropical disturbance that moves eastward around the global tropics every 30-60 days and has proven to influence rainfall and temperature conditions. The strength of the MJO may increase or decrease as it progresses eastwards, affecting the level of convection and influence on both precipitation and temperature. The diagram below is used by scientists to track the path of the MJO showing predicted dates through various phases (see December MJO explainer). A short YouTube cartoon explaining the MJO can be found here
9-day rainfall outlook

This morning’s 9-day ECMWF model loop shows coastal systems dominating the next period. A check around the grounds on the refreshed seasonal outlook shows a neutral/dry winter and a wetter spring when the IOD/Modoki develops. More detail next week.

Keep an eye on https://meteologix.com/au for more site-specific analysis.

Image loop courtesy Meteologix

Image loop courtesy Meteologix


Monitoring the MJO this Autumn

The chart below shows a weak pulse of the MJO in Phase 6 out in the Western Pacific Ocean. The last event didn’t result in any tangible difference in the climate apart from the very northern tips of Australia and parts of CQ. The high-pressure system camped over Australia’s interior kept most areas fine and mild. As the MJO moves back around to phases 8 etc. more likely we are to run into fine and clear conditions.

The Madden – Julian Oscillation (MJO) is a tropical disturbance that moves eastward around the global tropics every 30-60 days and has proven to influence rainfall and temperature conditions. The strength of the MJO may increase or decrease as it progresses eastwards, affecting the level of convection and influence on both precipitation and temperature. The diagram below is used by scientists to track the path of the MJO showing predicted dates through various phases (see December MJO explainer). A short YouTube cartoon explaining the MJO can be found here

New Release this week! - Understanding the Madden Julian Oscillation

Ever wondered what the Madden-Julian Oscillation (MJO) is? Confused by those weird spaghetti MJO spider charts?

Paul and Tonia Grundy at the CottonInfo YouTube production centre have been busy with Farmer Forecast this week, to explain why the MJO is worth the time to understand how it impacts farming operations. The MJO can be a major driver of heatwaves and rain events during the Australian monsoon.

Click on the link to play this 4-minute clip!

9-day rainfall outlook

This morning’s 9-day ECMWF model loop shows a scud over Central Qld (that missed much of the March rainfall activity) so let’s hope those dry areas can catch up on their 2021 totals.

A sneak peek of the refreshed multi-week models shows more of the same - clear and mild temps for the remainder of April, with the exception of another rain event for C Qld mid-month. Full analysis next week.

Keep an eye on https://meteologix.com/au for more site-specific analysis.

Image loop courtesy Meteologix

Image loop courtesy Meteologix