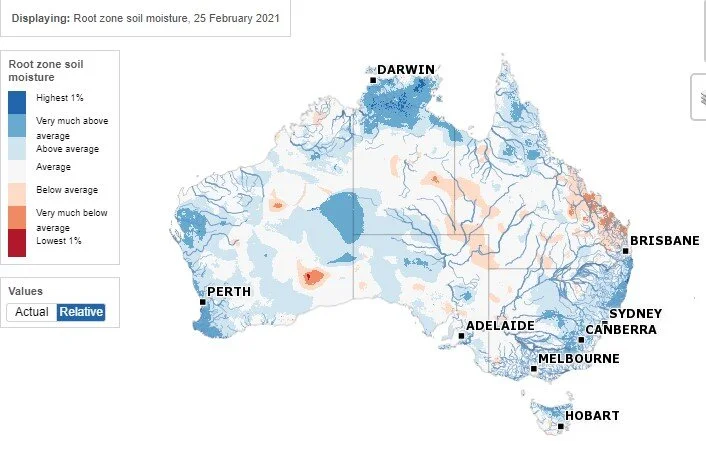
Monitoring soil moisture this winter copping season
/A big improvement over the last fortnight in eastern Australia and parts of Qld previously showing red. The salient feature is the drying trends in WA, SA and Vic. Farmers in those regions will be hoping for the wet phase of the Indian Ocean kicks-in sooner rather than later. Livestock from WA reportedly still being trucked east across the country to greener pastures also.